

Priced Forever
Measuring how long great companies stay great

When you buy a stock at ~38 times next twelve months earnings, what exactly are you paying for?
The instinctive answer is “earnings growth.” But that’s incomplete. You’re not just paying for next year’s earnings, or even the next five years. You’re paying for every dollar of profit the business will earn above its cost of capital, for as long as the market believes it can sustain that advantage. The implied duration of that competitive edge — how many years the market expects the company to earn returns in excess of its cost of capital — is the single most neglected variable in equity valuation.
That duration has a name. It’s the Competitive Advantage Period, or CAP.
In this post, I’m going to use the CAP framework to dissect three restaurant stocks I used to cover on the sell side: McDonald’s (MCD), Chipotle Mexican Grill (CMG), and Starbucks (SBUX). Each one sits at a different point in the competitive lifecycle. Each one tells a different story about what the market is implicitly betting on. And taken together, they offer a rigorous framework for thinking about relative value that most investors never bother to articulate.
What Is a Competitive Advantage Period?
The concept was formalised by Michael Mauboussin and Paul Johnson in their 1997 CSFB paper, "Competitive Advantage Period: The Neglected Value Driver", drawing on foundational work by Miller and Modigliani. The core idea is elegantly simple: a company's value can be decomposed into two parts.
Part 1: Steady-State Value. Imagine the company stops investing in growth entirely. It just harvests existing earnings forever. That perpetuity is worth NOPAT ÷ WACC. This is the floor — what you’d pay for the business if you expected zero excess returns on any future investment. NOPAT is net operating profit after tax; WACC is the weighted average cost of capital, the hurdle rate the business must clear to create value.
Part 2: Future Value Creation (FVC). If the company can invest at returns above its cost of capital — ROIC > WACC — then every dollar of incremental investment is worth more than a dollar. The longer it can do this (the CAP), and the wider the spread between ROIC and WACC, the more value accrues beyond the steady state. This is the growth premium.
Formally, the M&M equation states:
Value = NOPAT / WACC + I×(ROIC−WACC)×CAPI×(ROIC−WACC)×CAP / WACC×(1+WACC)WACC×(1+WACC)
Where I is the annualised investment rate in working and fixed capital. Rearranging for the implied CAP gives you what the current stock price is embedding as an assumption about competitive durability:
CAP = (Value × WACC − NOPAT) × (1 + WACC) / I×(ROIC−WACC)I×(ROIC−WACC)
Think of it this way: if you buy a restaurant stock at a 35x earnings multiple and the underlying business earns a 15% ROIC against an 8% WACC, you’re implicitly underwriting perhaps 25 years of above-cost-of-capital returns. Whether that assumption is reasonable — or absurd — is the question the framework forces you to confront.
Two things are immediately striking about this formulation. First, the spread (ROIC − WACC) matters enormously. A business with a wide spread needs fewer years to justify its price than one with a narrow spread. Second, not all years of CAP are created equal — a franchise model that earns $4,700M of FVC per year of CAP requires far fewer years than a company-operated model earning $830M per year, even if both have the same spread. The combination of spread width and reinvestment scale determines how much duration the market is implicitly demanding.
The Comparison
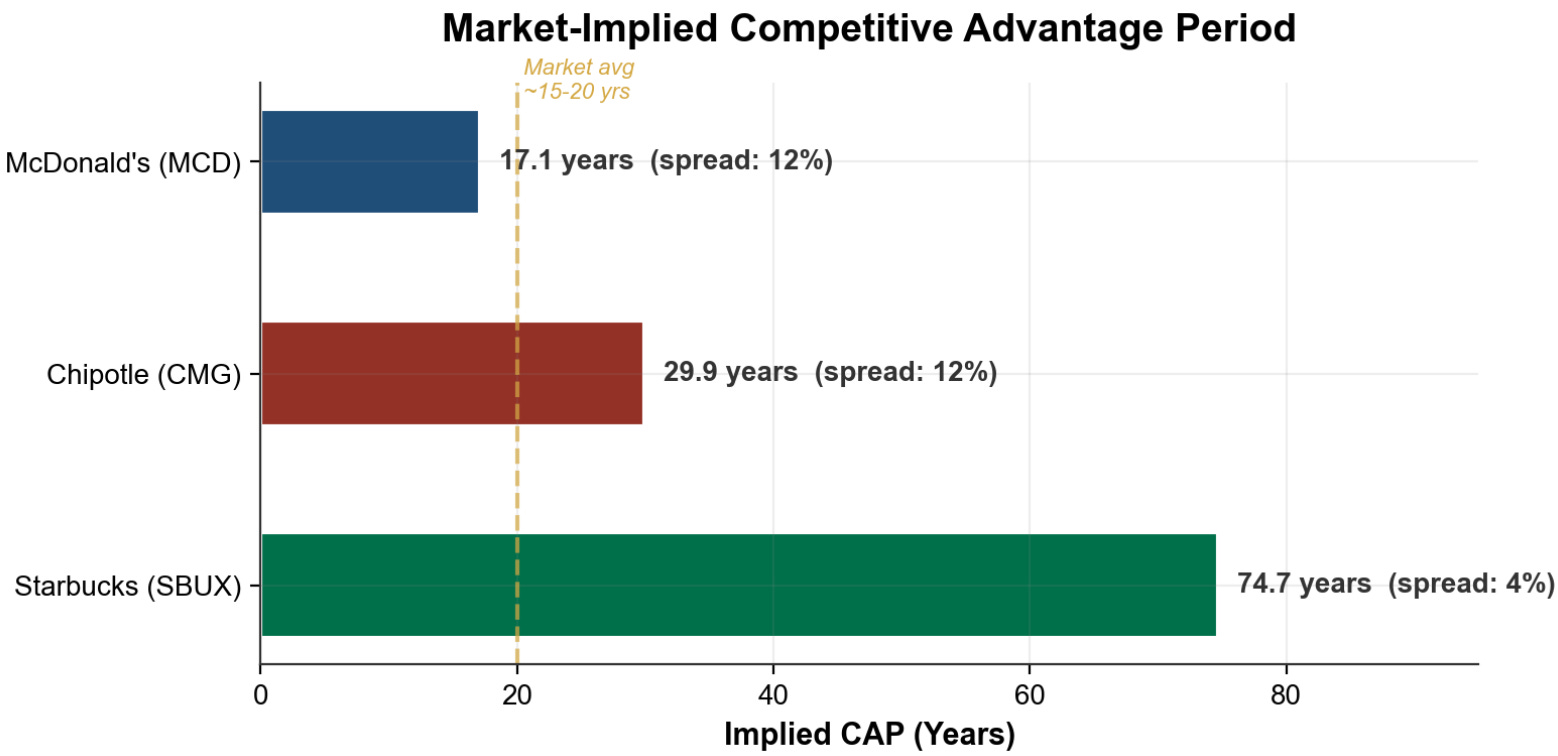
The contrast is striking even at a glance. MCD and CMG share the same 12% spread, yet CMG requires nearly twice the competitive duration to justify its price — because each year of CMG's CAP contributes less than a fifth of the dollar value of MCD's. And Starbucks' 74.7-year implied CAP isn't really a duration forecast at all; it's a diagnostic signal that the current spread is too narrow to support the valuation.
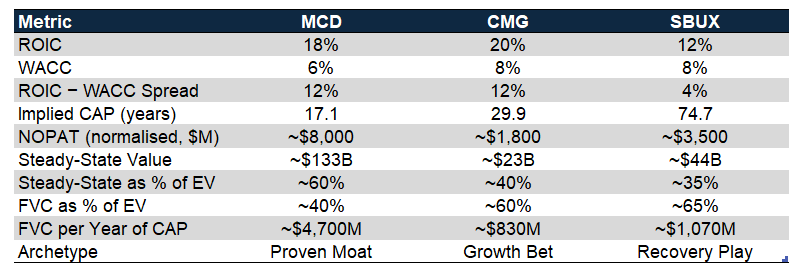
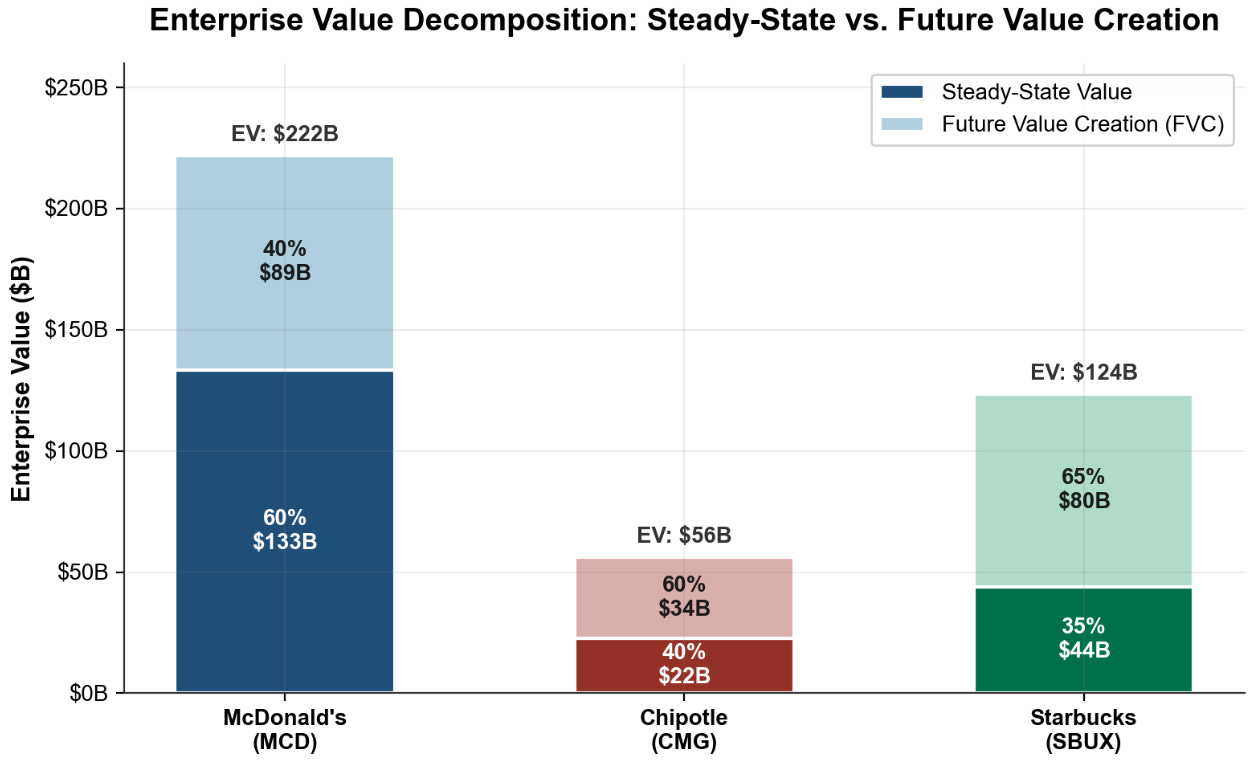
The stacked bars below tell the story visually. McDonald's is the only name where steady-state value (60%) anchors more than half the enterprise value. At both Chipotle and Starbucks, the majority of what you're paying for is future value creation — returns that haven't been earned yet.
McDonald’s (MCD): The Proven Moat
McDonald’s is the reference case. With ROIC running at 18–19% against a WACC of ~6%, the spread is a durable and well-documented 12 percentage points. The franchise model is the engine: roughly 95% of McDonald’s ~40,000 locations are franchised, meaning the company collects royalties (typically 5% of system sales) with minimal incremental capital. When you own the brand, the supply chain, and the real estate — without bearing the full operating risk — capital efficiency compounds in your favour.
The implied CAP of 17.1 years is the market saying: “McDonald’s can deploy incremental capital at 12 points above its cost of capital for the next seventeen years.” Given that the business has been doing exactly that for over seven decades across 100+ countries, this feels, if anything, conservative. The steady-state value (~$133 billion) represents roughly 60% of the enterprise value — a substantial anchor — with the remaining 40% as the growth premium. This is structurally healthy. You’re not paying predominantly for speculative future value creation.
Two structural moats deserve explicit recognition. First, brand power: McDonald’s loyalty programme had approximately 210 million active 90-day users by the end of 2025, creating a direct consumer relationship that reduces dependence on third-party platforms and structurally lowers customer acquisition cost. Second, real estate: McDonald’s owns or controls ground leases on a significant portion of its restaurant locations and subleases them to franchisees at a markup — a recurring, semi-fixed revenue stream with real-option value that most ROIC calculations understate.
The key risk is that 17 years of sustained 12% spread is not nothing. Secular headwinds — traffic softness in high-cost Western markets, consumer health trends, minimum wage inflation — could compress the spread over time. But each year of MCD’s CAP adds roughly $4,700 million in present value — by far the highest of the three. At current multiples (~25x trailing P/E), the market is pricing McDonald’s as a reliable compounder. That’s probably right. It’s also the least interesting trade of the three.
Chipotle (CMG): The Growth Bet
If McDonald’s is the reference case for a proven moat, Chipotle is the reference case for a pure growth thesis. The implied CAP of 29.9 years is the market pricing near-flawless execution across three full decades. To understand why this is demanding, you need to understand what Chipotle is — and what it isn’t.
Chipotle is an entirely company-operated model. There are no franchisees. Nearly every one of its ~4,000 locations (small number licensed outside of US) is owned and run by the parent, which means every new unit opening requires incremental capital deployed on the company’s balance sheet. ROIC has been climbing steadily, reaching ~25% on some methodologies by 2025, against a WACC of ~8–10%. The spread is real and improving. But the absence of a franchise model creates a fundamental tension in the CAP story: unit economics are strong, but capital intensity scales with the restaurant count.
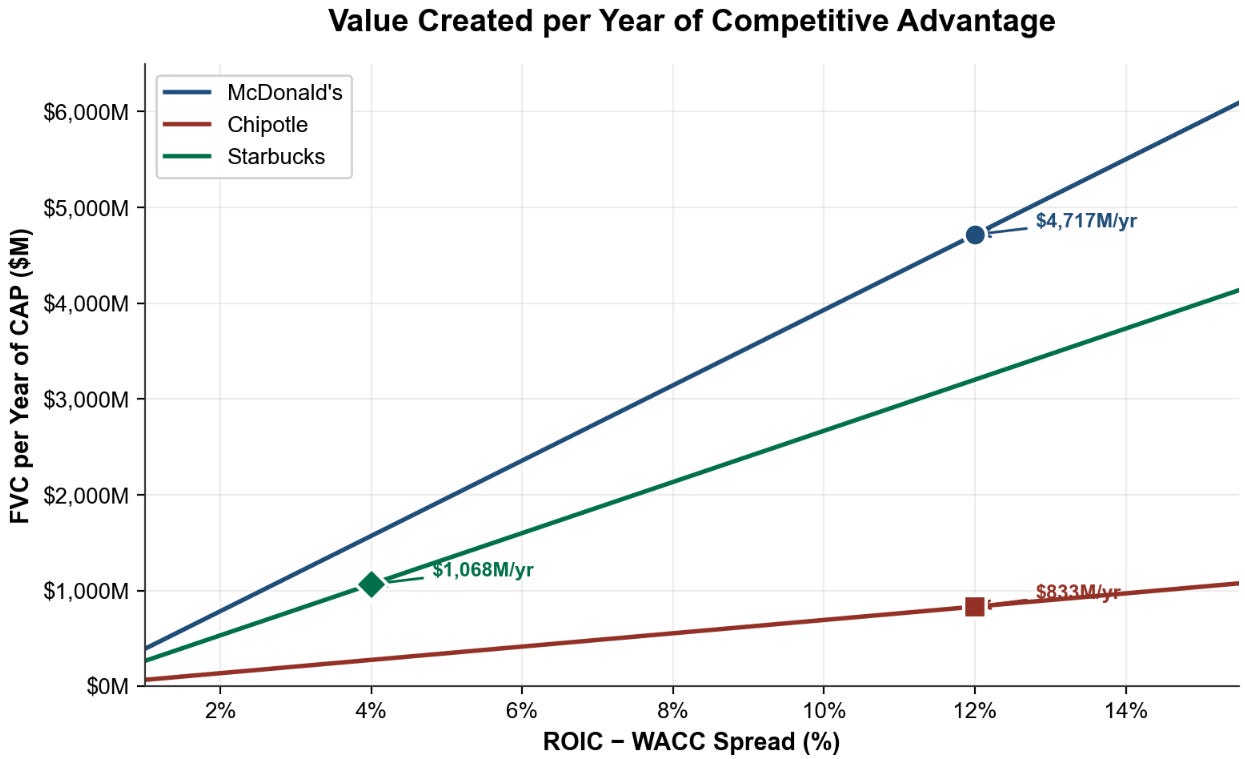
This chart reveals the hidden dynamic. Despite matching MCD’s 12% spread, each year of Chipotle’s CAP contributes only ~$830 million in present value to the enterprise value — less than a fifth of McDonald’s ~$4,700M. Why? Because the annual reinvestment rate (I) and the denominators differ: Chipotle reinvests ~$600M annually versus MCD’s ~$2.5B, and its higher WACC shrinks the present value of each year further. The result: Chipotle’s 30-year implied CAP is considerably more demanding than MCD’s 17 years, even though the spreads are identical.
At roughly 4,000 units today, Chipotle has often cited a long-run target of 7,000+ North American locations — significant runway. But reaching 7,000+ units while sustaining a 12-percentage-point spread requires same-store sales growth to hold, labour costs to stay manageable, and menu innovation to prevent trading-down. The 50-for-1 stock split in June 2024 brought the share price to the retail-accessible range, but the underlying valuation construct is unchanged.
With approximately 60% of Chipotle’s enterprise value attributable to future value creation, the stock is pricing an optimistic — though not impossible — future. The question is the denominator: what would compress the CAP? A sustained SSS deceleration, a food safety incident (as the company experienced painfully in 2015–16), or a structural shift in labour costs could all shorten the market’s patience. At 30 years, there is essentially no margin for error priced in.
Starbucks (SBUX): The Recovery Mirage
The 74.7-year implied CAP for Starbucks is, on its face, absurd. No analyst believes Starbucks will sustain above-cost-of-capital returns for three-quarters of a century. But here’s the critical insight: this number is not predicting the future, it is diagnosing the present.
When the ROIC-WACC spread is narrow — in Starbucks’ case, approximately 4% on normalised earnings — each year of CAP contributes only ~$1,070 million of present value to the enterprise value. The FVC per year is small relative to the EV of $123.5 billion. So the model mechanically requires a very large number of years to close the gap between the steady-state value (~$44 billion) and the current price. The 74.7-year output is the framework’s way of signalling: something structural must change for this price to make sense at a 4% spread. The market isn’t underwriting 75 years at 4%; it’s pricing a recovery in ROIC back to historical levels.
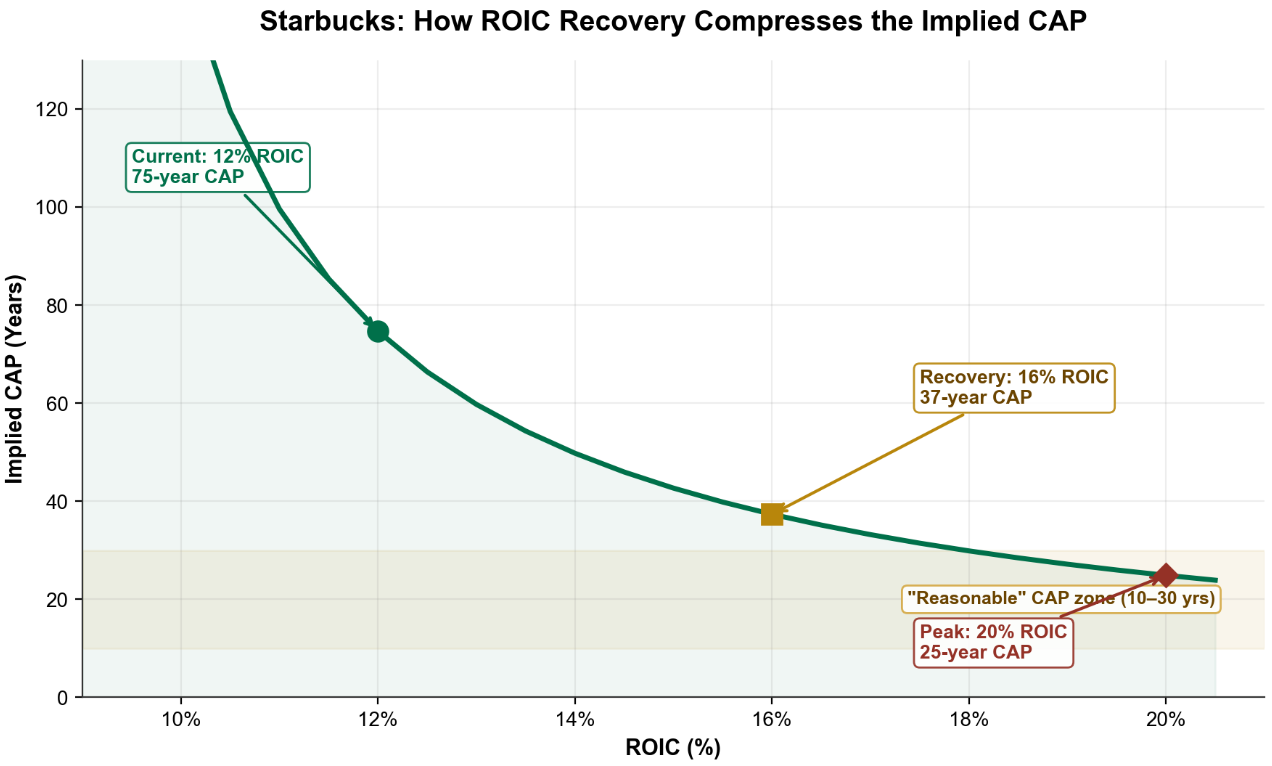
Consider the sensitivity. If Starbucks’ ROIC recovers to 16% — consistent with FY2023 levels of ~18–19% before margin compression — the spread doubles to 8%. At that spread, the implied CAP drops to approximately 37 years. Push ROIC back to its historical peak of 20%, and the CAP compresses further to ~25 years — entering the “reasonable zone” for a 40,000-unit global franchise with 30 million loyalty members.
The operating context matters. EBIT margin collapsed from 16.3% in FY2023 to 7.9% in FY2025 — a 840bps decline — as CEO Brian Niccol’s “Back to Starbucks” programme deliberately incurred short-term reinvestment costs to reverse operational complexity and restore throughput. Niccol, who joined in September 2024, is operating from a credible playbook — he executed a similar recovery at Chipotle following the food safety crisis. Early datapoints are constructive: Q1 FY2026 showed +4% comparable sales growth and +3% transaction growth, the first positive comp in two years.
Starbucks shares a structural characteristic with McDonald’s: negative book equity (-$8.1 billion), driven by aggressive buybacks over a decade. Like MCD, this makes ROIC calculations sensitive to methodology — the asset base is lean, and the reported invested capital understates the scale of the economic franchise. The stock is effectively a bet on ROIC normalisation: if margins recover toward 14–16%, the implied CAP halves and the current price looks reasonable. If the “Back to Starbucks” programme fails to restore volume, the 74.7-year CAP becomes a warning signal rather than a mechanical artefact.
What the Market Is Pricing — and Where It Might Be Wrong
Viewed together, these three stocks illustrate a spectrum of CAP-based risk:
McDonald’s is priced for continuity. The 17.1-year implied CAP is conservative relative to the business’s track record — a 70-year moat with $133 billion in steady-state value. There’s limited upside if the story holds (the multiple already reflects quality), but limited downside surprise if the thesis plays out as expected. This is the compounding anchor.
Chipotle is priced for ambition. The 30-year CAP requires the company to execute on unit growth, labour management, and brand relevance across a period spanning multiple economic cycles. The ROIC trajectory is genuinely impressive — rising from 14% in 2021 to ~25% by 2025 — but the multiple already prices this in. The risk-reward at these levels is skewed: the upside requires flawless execution, while the downside from any SSS deceleration or margin disappointment compresses a CAP that has very little buffer at 30 years.
Starbucks offers the most asymmetric setup. The 74.7-year implied CAP is a diagnostic, not a forecast. It signals that the market price cannot be justified by current ROIC — something must improve. If ROIC recovers to 16%, the implied CAP halves to ~37 years, and the business re-rates as a premium compounder rather than a turnaround. Early evidence from Niccol’s first two quarters is encouraging. The risk is that the “Back to Starbucks” reinvestment period is longer and more expensive than the market currently prices, keeping ROIC depressed for longer. At $100, the stock is pricing a successful recovery — but not yet pricing premium compounder multiples. That asymmetry is worth watching.
SBUX CAP model attached below.
The Bottom Line
The Competitive Advantage Period framework won’t tell you which stock to buy. What it does — ruthlessly and precisely — is tell you what you’re implicitly betting on at any given price. McDonald’s at 17 years is a continuity bet on the world’s most durable restaurant franchise. Chipotle at 30 years is a precision growth bet with no margin for error. And Starbucks at 75 years is a ROIC recovery trade hiding in plain sight.
Understanding the CAP you’re buying isn’t optional — it’s the whole game. Every multiple is a duration assumption. The only question is whether you’ve made it explicit.
Thanks for reading. Subscribe for more deep-dive special situations, underfollowed small caps, and mispriced equities.
- Uncovered Alpha
Disclaimer: This article is for informational and educational purposes only. It does not constitute investment advice, a solicitation, or a recommendation to buy or sell any security.