

Ackman vs Buffett
When does selling demonstrably add value — and when does it quietly cost 20% of terminal return?

Every value investor I know has read the Buffett letters. Most of us can quote the buy discipline from memory — circle of competence, margin of safety, wonderful businesses at fair prices. But if you actually look at what’s written across thirty years of annual letters, there is remarkably little said about when to sell. Buffett’s stated preference is “our favourite holding period is forever,” which is charming but not a decision rule you can code into a process.
I came across a piece of work recently (shoutout Brett Caughran) that tried to answer this empirically for Buffett alone — pulling every discretionary Berkshire 13F exit, stripping out the forced ones, and measuring forward alpha against SPY. I thought it was one of the more useful pieces of primary-data investment research I’d read in a while, and it left me with an obvious follow-up question: does the same test work on the other concentrated, high-profile value investor most often compared to Buffett?
Bill Ackman’s Pershing book shares a similar level of concentration, though with an activist-adjacent posture and arguably a more explicit sell discipline — thesis breaks get narrated in investor letters, mistakes get owned in real time. If selling skill shows up in the data for Buffett, it ought to show up for Ackman too.
So I extended the analysis. I wanted to know what the data actually says — not the prescriptions, the revealed behaviour — on both managers, on matched methodology, side by side. 175 Buffett exits (1999–2025), 78 Ackman exits (2004–2025), identical EDGAR pipeline, identical forced-exit scrubs, identical 12/36/60-month forward-alpha horizons, identical hit-rate and alpha conventions. As far as I can tell, nobody in the public-facing investment literature had run the comparison this way. What follows is what the data said — and what I’m changing in my own process because of it.
The One Sentence Worth Keeping
Selling skill is not evenly distributed, and the clearest practical implication — on a concentrated book, either the thesis is broken (exit completely) or it is intact (leave it alone) — is probably the most useful single rule to come out of 253 exits worth of primary data.
Why the Comparison Is Apples-to-Apples
Both studies use the same pipeline: pull every quarterly Form 13F-HR from SEC EDGAR; build a ticker-by-quarter holdings panel; flag an "exit" as a full transition from a non-zero reported position in quarter T to zero in T+1; remove forced exits (M&A, spin, LBO, reorg, CUSIP change) from the discretionary set; price each surviving exit against a sell-date proxy and measure forward alpha vs SPY at 12, 36, and 60 months.
Two differences to note explicitly. First, sell-date proxy: the Buffett study uses the midpoint of the last-held quarter and the first zero quarter; the Ackman study uses the first day of the month following the last-held quarter. This can introduce up to ~45 days of difference on identical trades, but is unbiased in direction across either sample.
Second, dividend adjustment: the Buffett returns are price-only (not dividend-adjusted); the Ackman returns are dividend-adjusted monthly. Since Pershing’s longs skew toward growth (NFLX, CMG, HLT, QSR, CP) and Berkshire toward yield-bearing financials and consumer staples, dividend adjustment modestly helps Ackman’s reported hit rate and modestly hurts Buffett’s — narrowing the gap by perhaps 3–5 pp at the 60-month horizon.
Both studies restrict to equity long 13F positions only. That means Ackman’s shorts (Herbalife, MBIA CDS), macro hedges (2020 COVID CDS, 2022–2024 Treasury futures shorts), and Pershing Square Holdings Ltd. non-US positions are excluded. Buffett’s preferred-and-warrant trades (GS, BAC 2008) are also out of scope. The comparison therefore speaks to selling skill on the long equity book, which is what matters for most private-investor readers.
Archetype classification for both studies uses the same method: for the top exits by dollar value, read every available primary source (annual letters, investor letters, press interviews, CNBC / Nikkei / Fortune / Institutional Investor coverage) and tag the stated trigger. Where the manager offers no public rationale — common for mid-size trims — the exit is tagged Portfolio Trim (Ackman) or routed to the closest fit (Buffett). Buffett’s archetypes are the seven defined in the source study; Ackman’s are an eight-bucket extension that adds Portfolio Trim and Activist Catalyst Complete — two patterns with no Berkshire analogue.
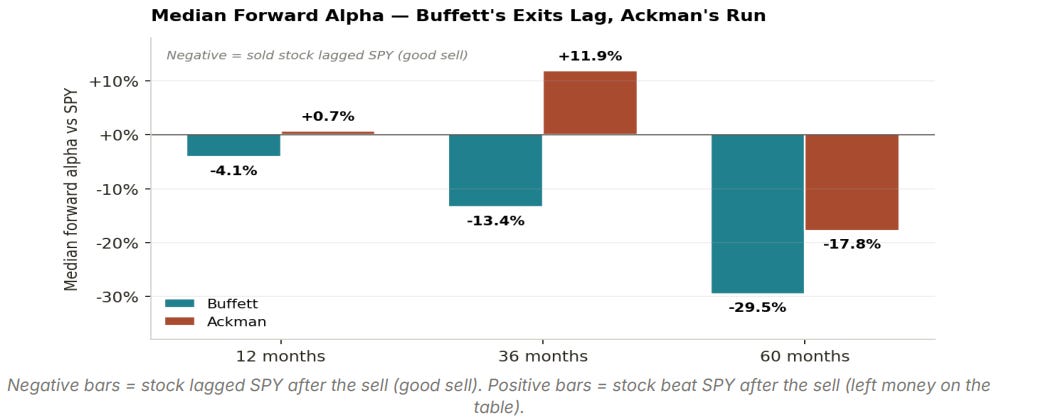
Hit rate convention is constant: hit rate = share of exits where the sold stock subsequently underperformed SPY. Under that convention a value higher than 50% means selling added value. Median alpha is signed consistently: negative = the stock lagged SPY after the manager sold it.
Evidence — Who Sells Skillfully?
At every horizon, on every metric, Buffett’s numbers sit on the skilled side of the line and Ackman’s sit on the unskilled side. The 36-month window is the cleanest view because it is long enough for a stock’s post-exit fundamentals to materialise, but short enough that the sample size (n = 95 for Buffett, n = 50 for Ackman) still supports meaningful tests.
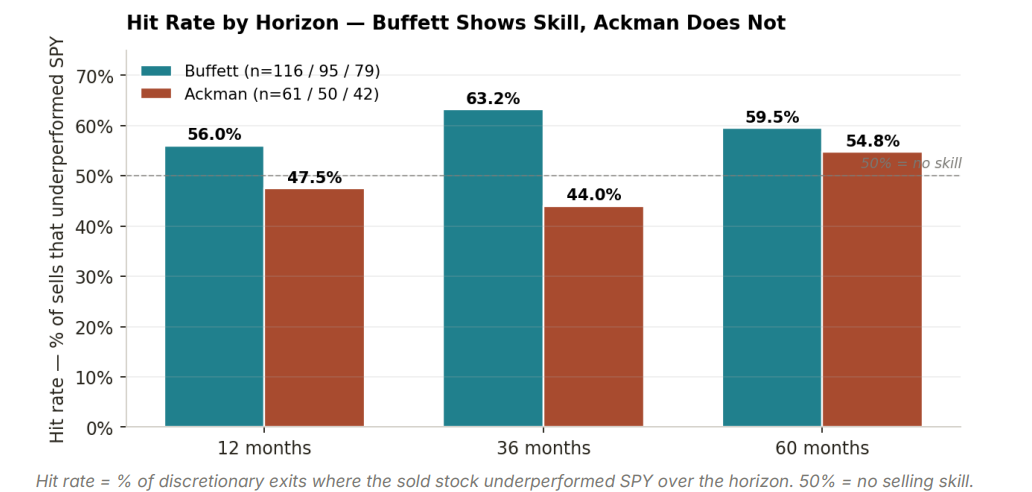
Buffett clears the 50% threshold at all three horizons; the 36-month figure is statistically significant under a binomial sign test (p = 0.013). Ackman clears 50% only at 60 months (54.8%), and none of his three sign-tests reach conventional significance (all p > 0.40). The 36-month gap — 19 percentage points in Buffett’s favour — is the single cleanest summary of the skill differential.
Put simply: Buffett's sells pay. Ackman's sells leave money on the table.
Median alpha strips out a few tail winners and losers. For Buffett the median is −4.1% / −13.4% / −29.5% at 12 / 36 / 60 months — every signed negative number represents a stock that lagged SPY after he sold it. For Ackman the medians are +0.7% / +11.9% / −17.8%. The 36-month median is the most damning: the typical Ackman exit outperformed SPY by 12 percentage points over the following three years.
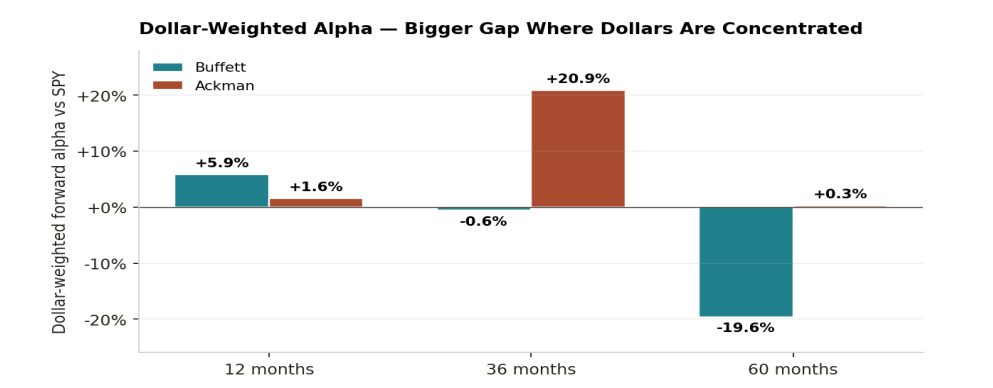
Dollar-weighted alpha answers "did the biggest sell decisions work?" Buffett’s dollar-weighted 60-month alpha is −19.6% — his largest exits were his best exits. Ackman’s dollar-weighted 36-month alpha is +20.9%: his largest exits by position size went on to out-earn SPY by over 20% in the next three years. The single biggest exits (Chipotle 2019, Lowe’s 2021, Hilton, Zoetis) kept compounding after he sold.
Era Breakdown — Did Both Improve?
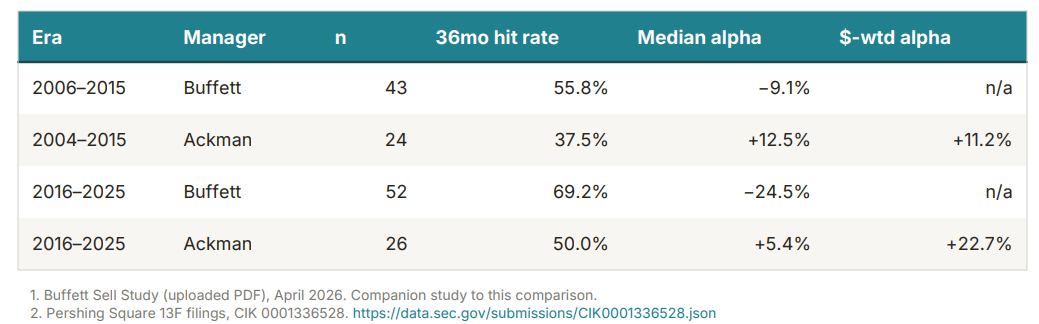
Both studies naturally split into an earlier era and a post-2015 era. For Buffett the split is 2006–2015 vs 2016–2025 (dictated by SPY price-data availability in the source study). For Ackman the split is pre-Valeant (2004–2015) vs post-Valeant (2016–2025). The comparison at the 36-month horizon shows both managers improved, but only Buffett crossed the 50% skill threshold.
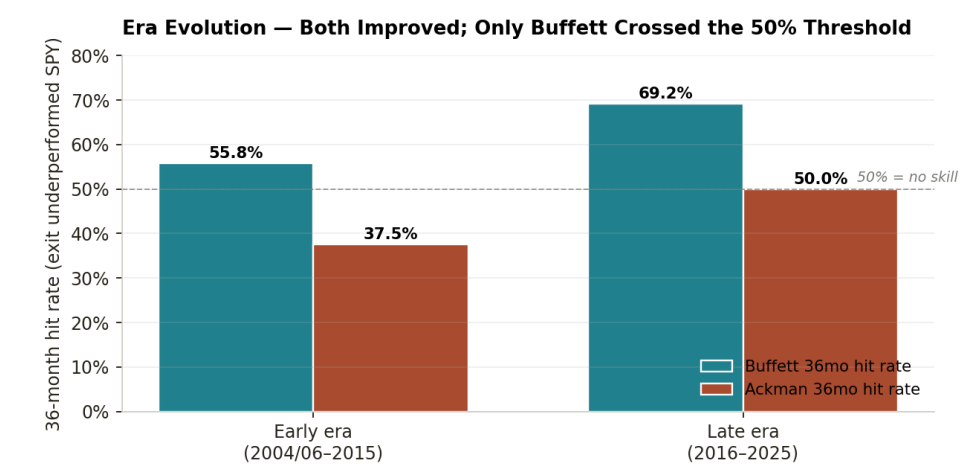
Two interpretations are consistent with the data. First, both managers learned: Buffett from the 2008 financial crisis and the Wells Fargo / airline post-mortems; Ackman from the Valeant drawdown that cost Pershing ~$4B and publicly embarrassed him mid-thesis. Second, late-era improvement looks different for each. Buffett’s late-era edge shows up as faster recognition of institutional risk (TSM geopolitics, the 2020–2023 bank reduction before the 2023 regional collapses).
Ackman’s late-era improvement shows up as one decisive mistake admission (Netflix, one quarter) and tighter capital redeployment discipline — but the dollar-weighted alpha got worse because the biggest 2021–2024 trims (Chipotle, Lowe’s, Hilton) kept running. The era table below quantifies this. Notice that Ackman’s 36-month dollar-weighted alpha climbs from +11.2% pre-Valeant to +22.7% post-Valeant — he got better at picking exits per unit of capital, but paradoxically left more dollars on the table because he was also deploying larger positions.
Why They Sell — Archetype Comparison
The single most instructive finding in both studies: valuation alone almost never triggers a complete exit. In Buffett’s top 17 by dollar value, zero exits are tagged as "stock too expensive" trims. In Ackman’s top 17, the same is true — though half of his top exits are classified Portfolio Trim, which is effectively an admission that the manager never publicly articulated a business-level reason for selling. The distribution of why is therefore dramatically different between the two.
Reading the Archetype Gap
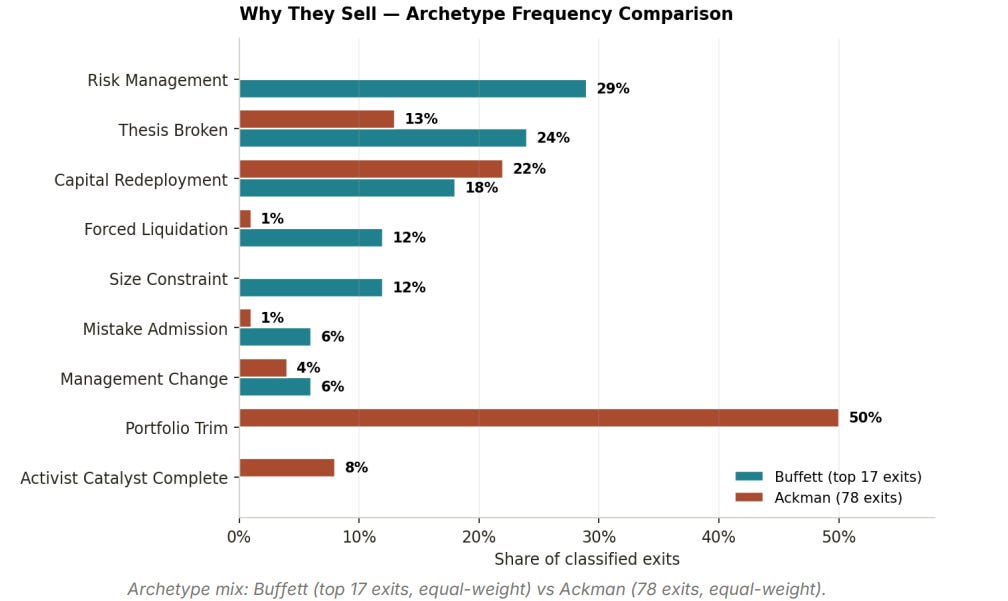
Four structural differences emerge from a side-by-side reading of the archetype mix.
Buffett sells on risk; Ackman sells on sizing.
29% of Buffett’s top exits are Risk Management — Freddie Mac 2001 on the tobacco-bond cockroach, TSM 2023 on Taiwan geopolitics, the 2020–2023 bank reduction on maturity-mismatch concerns. Zero of Ackman’s top exits fit this bucket on the long book. Pershing addresses tail risk through separate macro hedges (COVID CDS, Treasury futures shorts) rather than by exiting longs. This is coherent given the firm structure — but it means the long book carries no "cockroach" discipline, and the long-book sell decisions are therefore mostly reactive.
Ackman's Portfolio Trim bucket has no Berkshire analogue
Fifty percent of Ackman’s 78 exits are Portfolio Trim — decisions with no publicly articulated business reason, usually tagged by Pershing as "portfolio management" or "rebalancing." These trims carry the worst mean forward alpha of any archetype (+5.3% at 36 months, indicating the trimmed stock beat SPY thereafter). The closest Berkshire analogue is the Size Constraint bucket (12% of top 17: Costco, Torchmark), but Buffett famously describes every Costco trim as a mistake — and Costco is one of the biggest opportunity costs in Berkshire’s 30-year record. Both managers share the pathology, but for Ackman it is structural, not occasional.
Thesis Broken looks the same — and pays the same.
Buffett’s IBM and airline exits, and Ackman’s Netflix and JCPenney exits, are functionally identical: an identifiable, pre-stated thesis is falsified by new evidence, and the position is exited inside 18 months (IBM, JCP) or one quarter (airlines, NFLX). Both managers publicly admit the mistake. Both manage to end the position before the deepest drawdown. In both datasets, Thesis Broken exits also carry the highest positive post-exit alpha — meaning even when the stock later recovers, the manager’s decision to leave was correct on risk-adjusted grounds. IBM returned mid-single digits post-exit; NFLX tripled off its 2022 low.
Capital Redeployment is the rationale both managers trust.
18% of Buffett’s top exits and 22% of Ackman’s are Capital Redeployment — the capital has a better home than the name being sold. Buffett’s XOM exit (−72% 60-month alpha) is the textbook example; Ackman’s ADP and Zoetis are the equivalents. The shared lesson: if you can name the better home, the redeployment exit tends to work; if you cannot (the Portfolio Trim pathology), it probably does not.
Eight Rules, Two Records
The Buffett study distilled eight decision rules from 175 exits and the stated rationale for the top 17. Using Ackman’s 78 exits as an out-of-sample test, we can score each rule against Pershing’s revealed behaviour.
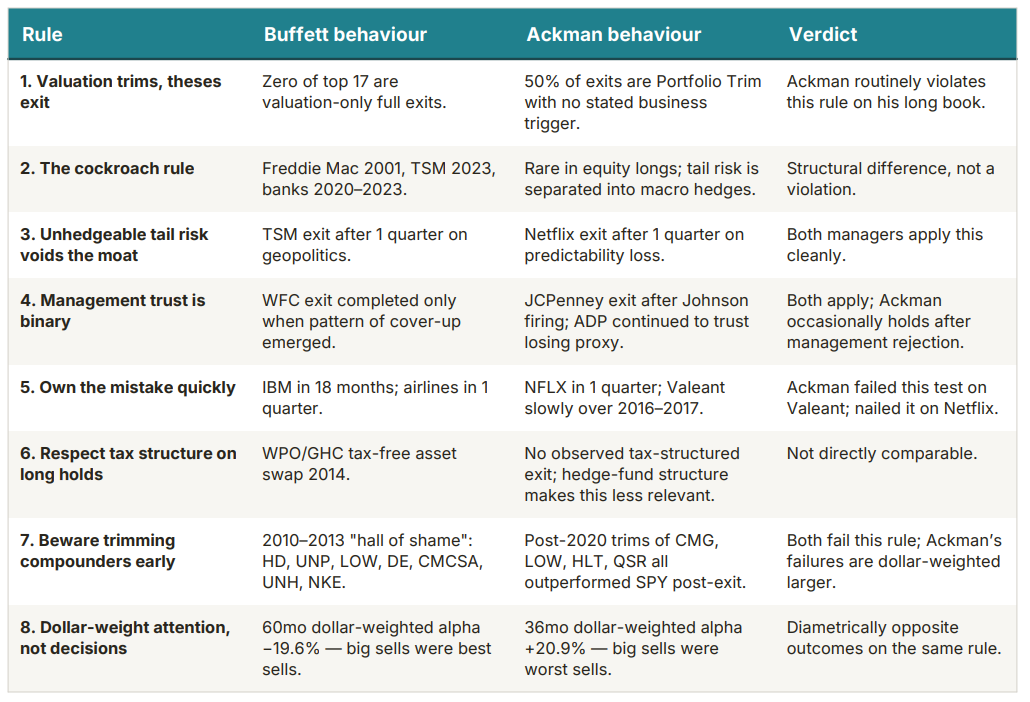
The striking result is rule 8. Buffett’s big sells are his best sells; Ackman’s big sells are his worst. That inversion is the clearest single data point supporting Buffett’s revealed preference for forever-holds and Ackman’s revealed preference for high-turnover rebalancing. On a concentrated portfolio of 10–15 names, rule 8 argues strongly against trimming winners for sizing reasons.
Two Thesis-Broken Exits
The closest behavioural match between the two managers is the Thesis Broken archetype. Buffett’s airline exit (Q2 2020) and Ackman’s Netflix exit (Q1 2022) are functionally identical decisions, executed with nearly identical speed.
Buffett — Airlines (DAL, LUV, UAL, AAL), Q2 2020
"Our airline position was a mistake. Berkshire is worth less today because I took that position than if I hadn’t... The world has changed for the airlines." — Warren Buffett, Berkshire Annual Meeting, May 2, 2020
Airlines rallied sharply in the 12 months after Buffett’s sale (DAL +49%, LUV +58%, UAL +57%). By 60 months, DAL had lagged SPY by 17% and LUV by 95% — the longer-horizon thesis proved right, the tactical timing was poor.
Ackman — Netflix (NFLX), Q2 2022
"Given the concentrated nature of our portfolio, we require a high degree of predictability in the businesses we own. One of the lessons of our prior mistakes is to act quickly when we determine that we have made an investment mistake. That is what we are doing here." — Pershing Square investor letter, April 20, 2022
NFLX fell another 22% over the next six weeks, then tripled off its 2022 low by late 2024. Ackman’s decisive one-quarter exit avoided $200M of additional drawdown but cost Pershing roughly $2B of foregone upside. Forward alpha: +97.3% at 12 months, +462% at 36 months. This is Ackman’s single worst post-exit alpha — and yet, by the test Buffett articulates in Rule 5, it was the correct decision under the Pershing mandate.
Selling skill is not evenly distributed. Buffett has it; Ackman, on this dataset, does not.
Why This Isn’t a Cheap Shot at Ackman
Ackman is a demonstrably skilled buyer and activist — the study is not about overall returns, it's about one narrow skill: the decision to fully exit a long position. The methodology is the cleanest apples-to-apples comparison I could construct: same EDGAR pipeline, same forced-exit scrubs, same 12/36/60-month forward-alpha measurement against SPY. Minor differences (sell-date proxy, dividend adjustment) narrow the gap by an estimated 3–5 pp but don't flip the sign.
What I’m Taking Into My Own Process
This is where I think the study earns its keep for a working analyst. Six things I'm writing down on my desk:
Separate two sell decisions: “thesis broken” and “sizing.” Only the first should ever fully exit a position.
If I can’t name the better home for the capital, I probably shouldn’t redeploy. Capital Redeployment works when the alternative is articulated (Buffett’s XOM → other names, Ackman’s ADP, Zoetis); it fails when it’s really just a trim dressed up.
Valuation alone is not a full-exit trigger. Zero of 34 top exits between the two of them were valuation-only. If a compounder gets rich, consider trimming the risk, not the position.
The cockroach rule deserves a dedicated line in my notes. Buffett’s Freddie Mac 2001, TSM 2023, and 2020–2023 bank reduction all started from a single “that doesn’t smell right” observation that led to a full exit. In restaurant land, my own equivalents are franchisee health signals, supplier accounting oddities, or executive departures that don’t get a clean narrative.
Own mistakes in one quarter, not three years. Ackman failed this on Valeant (slow bleed, 2016–2017) and nailed it on Netflix (one quarter). The delta between those two outcomes is the difference between a career-defining loss and a recoverable bruise.
On a concentrated 10–15 name book, do not trim winners for sizing reasons alone. This is the single strongest statistical finding in the study, and it directly contradicts the instinct to “rebalance” a compounder that’s become 12% of the book.
Thanks for reading. Subscribe for more deep-dive special situations, underfollowed small caps, and mispriced equities.
- Uncovered Alpha